Marketplace metrics: 26 key metrics and how to use them
What metrics should a marketplace founder track? And how to translate what you track into action? Here’s how to identify and track the key metrics, how to separate them from vanity metrics, and how to make concrete decisions based on reliable data.

Last update

According to a study by McKinsey, data-driven organizations are 19 times more likely to stay profitable. But what data, exactly, should you track? And how to translate that data into concrete action?
For a startup, the list of metrics you could keep an eye on is nearly endless. But tracking too many things can be just as bad as not tracking enough. If you don’t have a clear understanding of what is essential, you risk putting too much emphasis on surface-level vanity metrics and losing sight of where you should direct your actions.
In this article, you’ll learn:
- The 26 key marketplace metrics: what they are, what they tell you, and how you can calculate and track them.
- How to combine the metrics to track the four key areas of your marketplace: the user funnel, liquidity, unit economics, and revenue.
- How to set up tracking for an early-stage marketplace.
The second point is valuable because it helps you identify which metrics are critical for your business, and which are distractions. As you’ll learn, the most important thing for any marketplace is understanding and tracking liquidity.
The 26 most common marketplace metrics are:
- Visits
- Bounce rate
- Visit duration
- Conversion rate
- Active users
- Number of transactions
- Churn rate
- User satisfaction metrics (e.g., Net Promoter Score)
- Repeat purchase rate
- Repeat buyer ratio and volume
- Repeat seller ratio and volume
- Buyer-to-seller ratio
- Sell-through rate
- Average time to sell
- Purchase rate
- Search-to-fill rate
- Customer acquisition cost (CAC)
- Seller acquisition cost
- Revenue per transaction
- Cost per transaction
- Contribution Margin Per Transaction
- Customer lifetime value (CLV)
- Gross Merchandise Value (GMV)
- GMV retention
- Take Rate
- Total Revenue and Net Revenue
However, you likely don’t need to track all of them. What counts is how you combine the data meaningfully to help your decision-making.
The key for a marketplace founder is knowing how well you connect the two sides of your marketplace and provide value. While traditional startup metrics like active users, net revenue, and Customer Acquisition Cost (CAC) are important, alone they’re not actionable enough. They don’t tell you what you need to do to grow and improve your marketplace.
If you’re looking to raise funding, you’ll also notice that these metrics aren’t enough to impress investors.
Below, I’ll discuss each of the 26 key marketplace metrics. I’ll divide them into four key areas to analyze for your marketplace:
- User funnel
- Repeat usage
- Liquidity
- Unit economics
- Revenue
The most important area is liquidity because it measures how well you connect the two sides of your marketplace and provide value to your audience.
User funnel is a model used to help online businesses understand the users’ journey on a website. Typically, the funnel stages are described as awareness, consideration, and conversion. (And often, after conversion comes loyalty, which we'll adress in the following paragraph that discusses repeat usage metrics).
Most online businesses monitor some combination of these basic website usage metrics. Where marketplaces differ from eCommerce stores and other traditional websites is that, essentially, marketplaces have two distinct user funnels: the seller funnel and the buyer funnel. On a peer-to-peer marketplace, the groups are likely fairly similar, with lots of overlap. On a B2C marketplace, they’re very different, which means the funnels are best tracked separately.
Analyzing your user funnel helps you understand where the bottlenecks are. Are you bringing in many users who abandon your site immediately? Are visitors creating accounts but not making transactions? Do buyers leave your site after one purchase and never return?
These types of questions help you understand where you should focus your improvement efforts. User funnel data is especially helpful for identifying how and where your marketplace UX needs work.
Furthermore, these three metrics are not only interesting to you. If your sellers are savvy, they will ask about them as well.
The problem, however, is that many founders only track the user funnel. (And then focus all their effort on improving surface-level metrics like the number of visits or user signups). That’s because for many sites, like social media platforms, they truly are the most important metrics.
For marketplaces, this is almost never the case. As you’ll learn later in this article, what matters most for a marketplace is reaching liquidity. Because of this, many user funnel metrics can actually be little more than vanity metrics for a marketplace.
That said, here are the metrics you can use to track your marketplace user funnel:
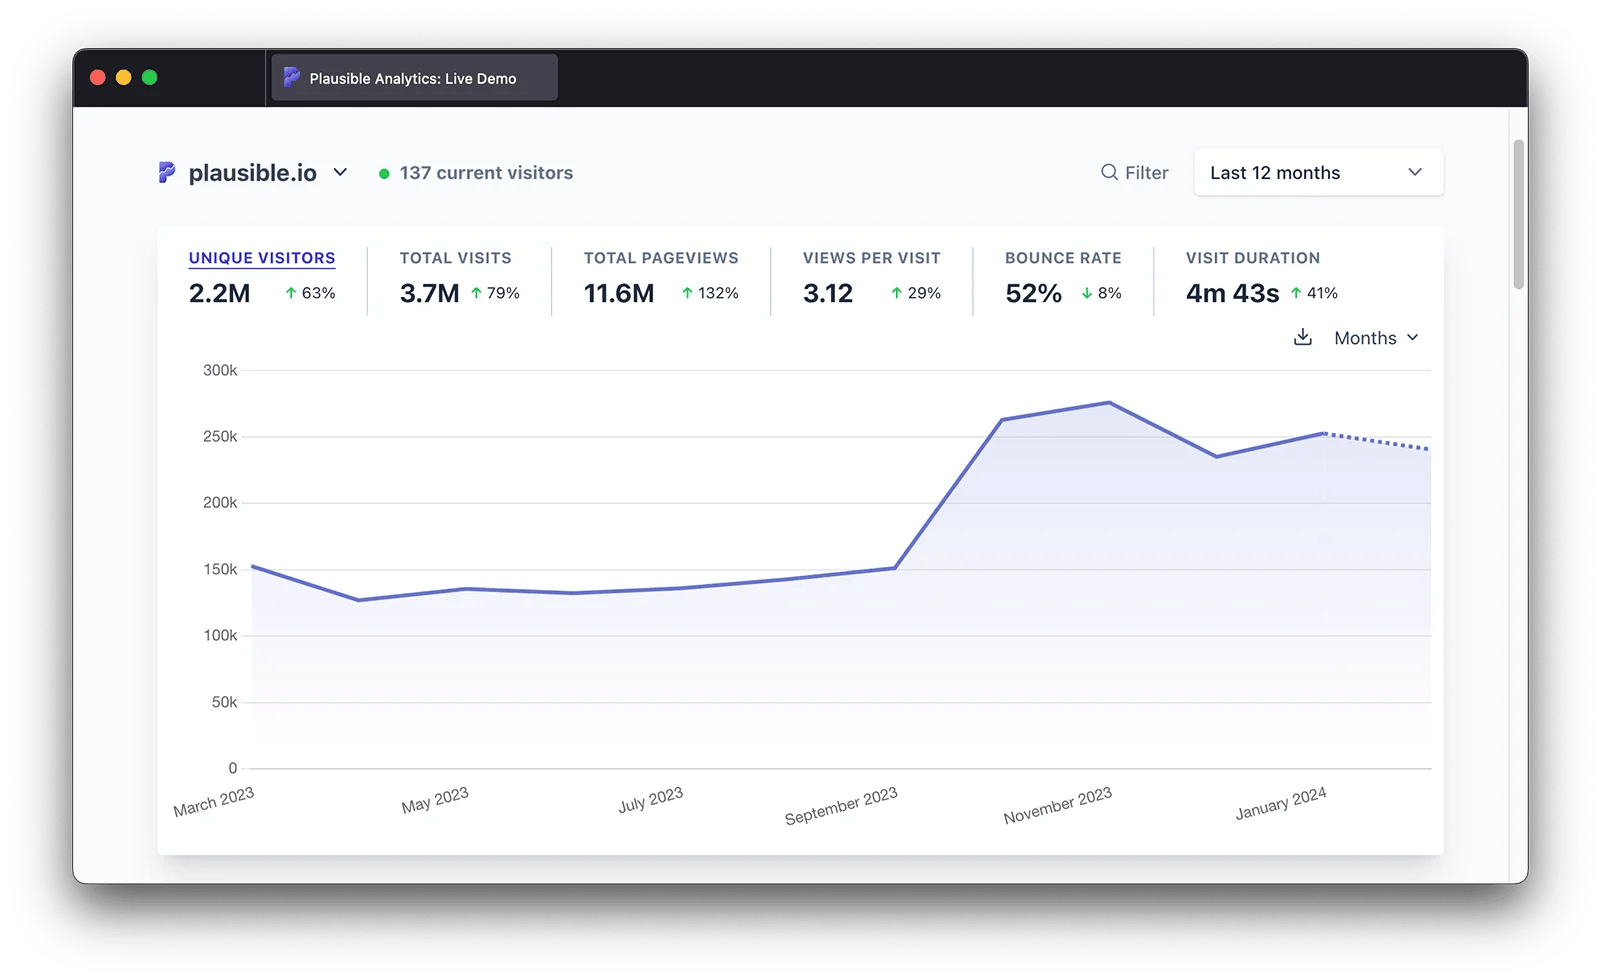
Visits measure the total number of unique visitors to your marketplace. This metric is influenced by how well you’re able to generate awareness and interest for your marketplace brand through marketing strategies like marketplace SEO, ads, or influencer marketing.
Visits can be tracked using web analytics tools such as Google Analytics or Plausible (a privacy-friendly alternative to Google Analytics). These tools provide detailed reports on visits, unique visitors, page views, and more.
A high volume of visits indicates a strong interest in your marketplace, which is essential for growing it. It also helps assess the effectiveness of your marketing and SEO strategies. However, a high number of visits is meaningless if the visitors don’t engage with your marketplace.
Getting lots of visitors on your site is not very helpful if they leave immediately without actually doing anything. Bounce rate measures the percentage of visitors who enter your site and leave right away ("bounce") rather than staying engaged with it in some way.
Similarly to visits, your website analytics tool tells you the average bounce rate for your entire site, as well as the average bounce rate per page.
A high bounce rate might indicate that your user acquisition strategy isn’t working: you’re bringing in people who aren’t a good match for your offering. This could be particularly helpful information if you’re testing new marketing campaigns or pages and want a good proxy metric for gauging interest right away (before you’ll have accumulated data on conversions, for example). Another problem a high bounce rate might indicate is a bug in your UX.
However, bounce rate is of limited use as a metric in isolation. Benchmarking some industry averages can give you some insight into what you can expect.
If your users do not bounce, you can start measuring how much time they spend on your site.
Visit duration is another standard metric most website analytics tools give you.
Visit duration helps you understand user engagement on your site. In general, the higher the visit duration, the more interested users are in your offering.
However, the nature of your marketplace will determine how important this metric is to you.
For social media sites, the goal is to have people spend as much time as possible on the site. Marketplaces with a strong social media component to them, such as Poshmark or Vinted, may find visit duration a very relevant metric.
For other types of marketplaces, visit duration might be less relevant. Note also that in combination with a low conversion rate, long visit durations could also indicate that users have a difficult time finding what they’re looking for.
Traditionally, a website's conversion rate is measured by the percentage of unique visitors who make a purchase on the site. However, conversion rate is more nuanced for marketplaces.
So, it’s more helpful to understand conversion rate as the percentage of users that perform a desired action. This action could be a purchase, or it could be signing up to your marketplace or creating a listing. It’s also important to note that conversion may look different for your sellers and buyers.
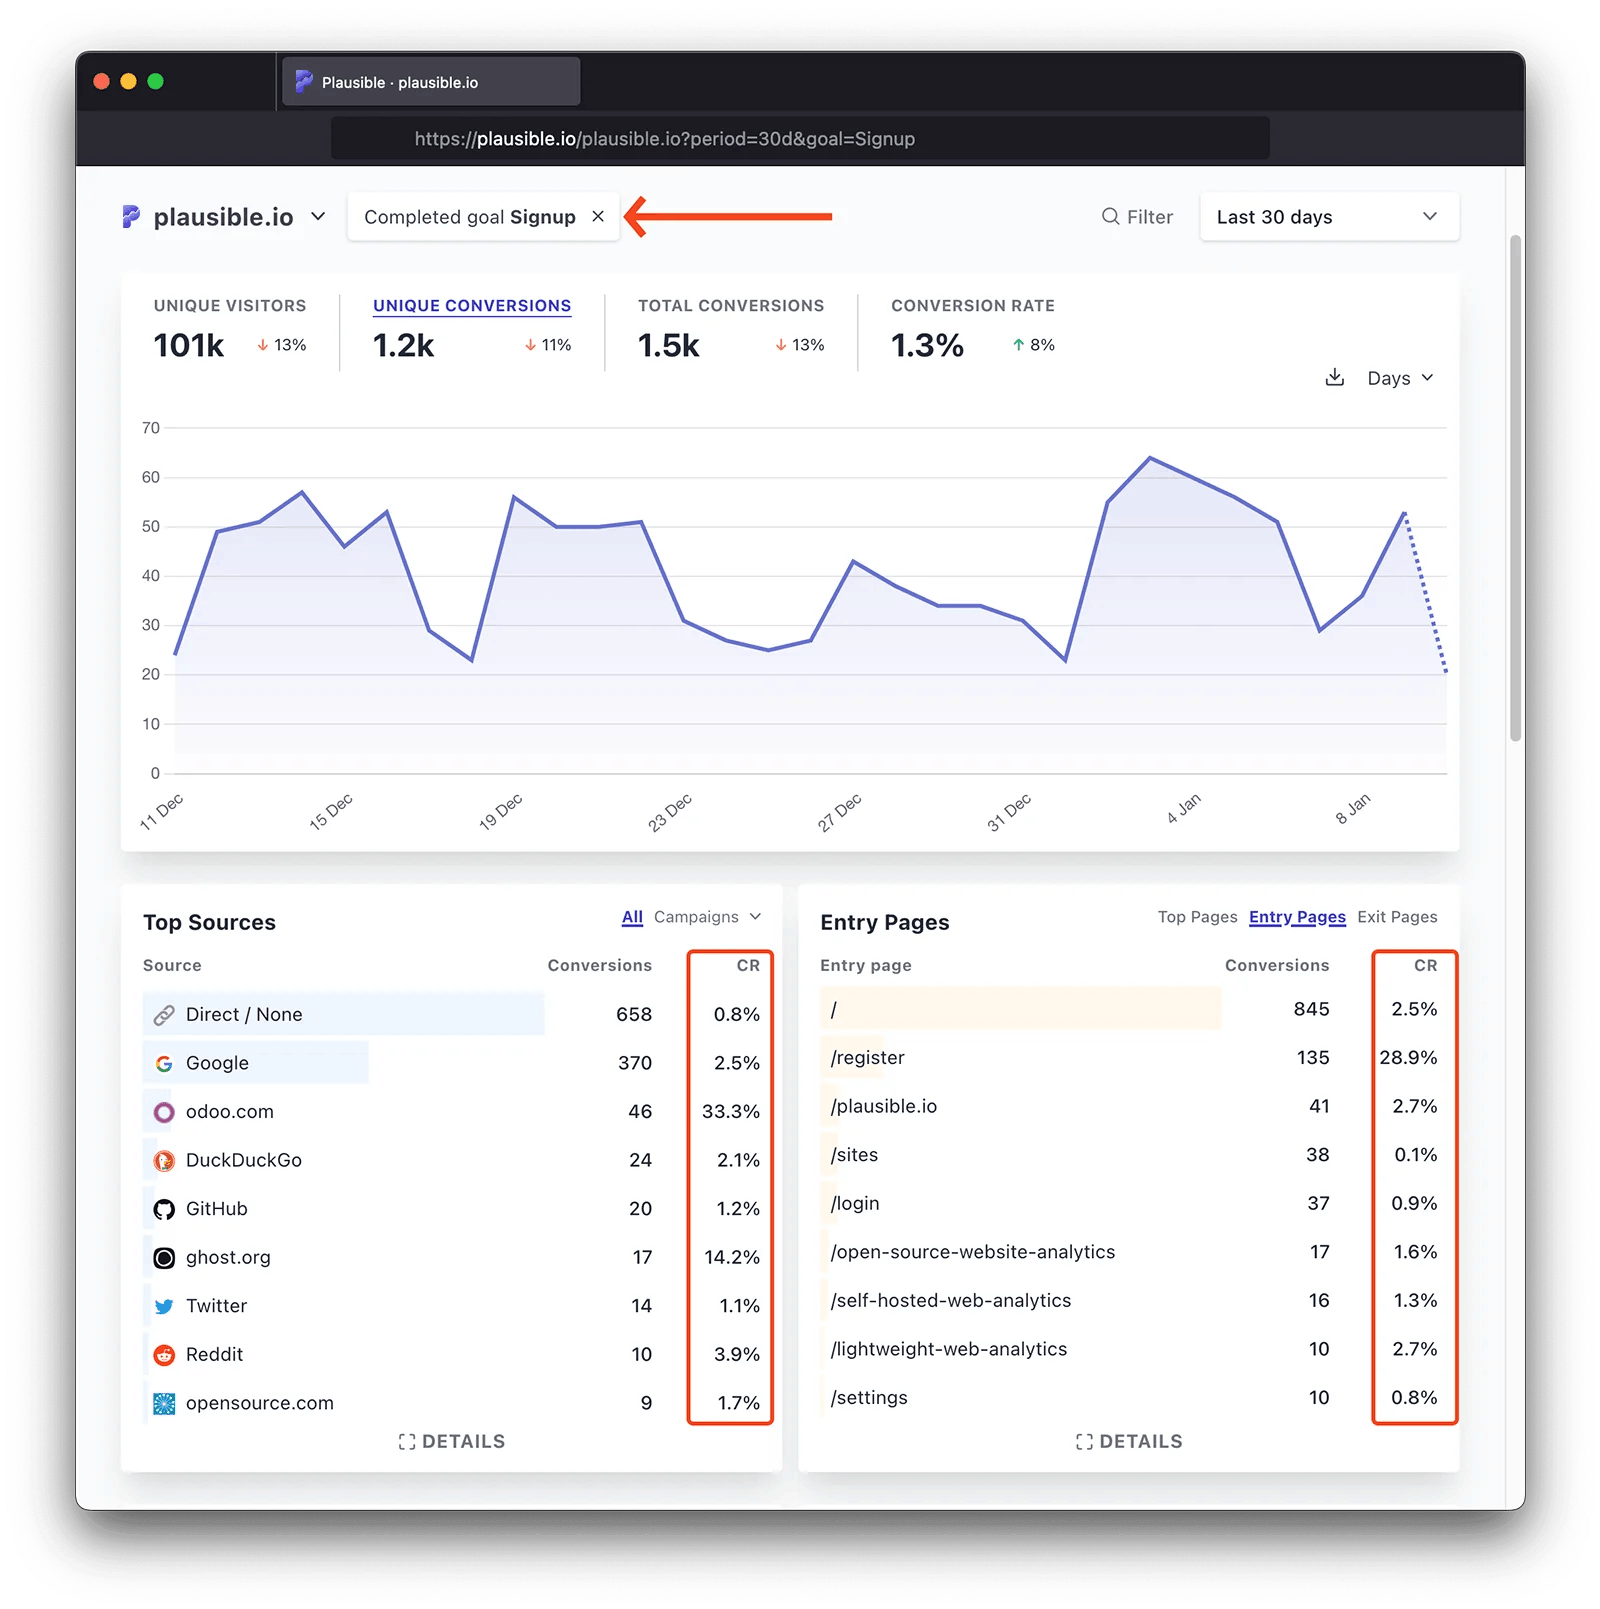
In most analytics tools, you can set up custom events to track on your marketplace. These can be things like account creations, newsletter signups, purchases, listing creation—any even that is meaningful to track on your marketplace.
When the event has been set up, you can track the share of visitors that completed that goal on your site on average, or on a specific page, through a specific channel, and so on.
Conversion rate tells you many things.
First of all, it sheds light on the effectiveness of your marketing campaigns. If you’re bringing in lots of people but the conversion rate is low, you might be targeting the wrong audience.
Another thing to consider if your conversion rate is low is your marketplace UX. Maybe you’re bringing in the right people, but something on your website isn’t working or the signup flow is difficult to understand. This could be the case if your bounce rate is low and time spent on page is high, but no conversions are happening.
Generally, conversion rate can speak to your product-market fit. If you have the right kind of product and you’re introducing in to the right kind of market, this should result in a good conversion rate.
Keeping a close eye on conversion rate is particularly important after you make significant changes to your homepage or signup UX.
Active users is the number of people that engage with your marketplace. Engagement typically refers to an action beyond visiting the marketplace, such as browsing a listing, signing up, making a purchase, interacting with other users, and so on.
Typically, this is reported as daily active users (DAU) or monthly active users (MAU).
To track active users, you need to identify unique users who perform at least one significant action on the platform within a month. This can be achieved with events tracking, which is possible on analytics tools like Google Analytics and Plausible.
The number of active users tells you about the success of your user acquisition and retention efforts. At the end of the day, the growth of your marketplace depends on how well you’re able to grow your user base.
That said, the problem with DAU or MAU is that too many marketplace founders take it as their North Star Metric and focus all their efforts on growing it. In reality, a huge number of active users is meaningless for a marketplace if supply and demand aren’t well-matched and transactions aren’t happening.
If the number of active users is a vanity metric, then how about the number of transactions?
The number of transactions measures the total number of completed sales or bookings handled by your marketplace within a given period. As transactions are the source of a marketplace’s income, this metric is closely connected to your marketplace growth.
Where you find your number of transactions depends on your setup. In most cases, you'll have a dashboard, or you can find this information in your marketplace backend. Here's an example of how transactions are reported on Sharetribe's Console where you manage your marketplace.
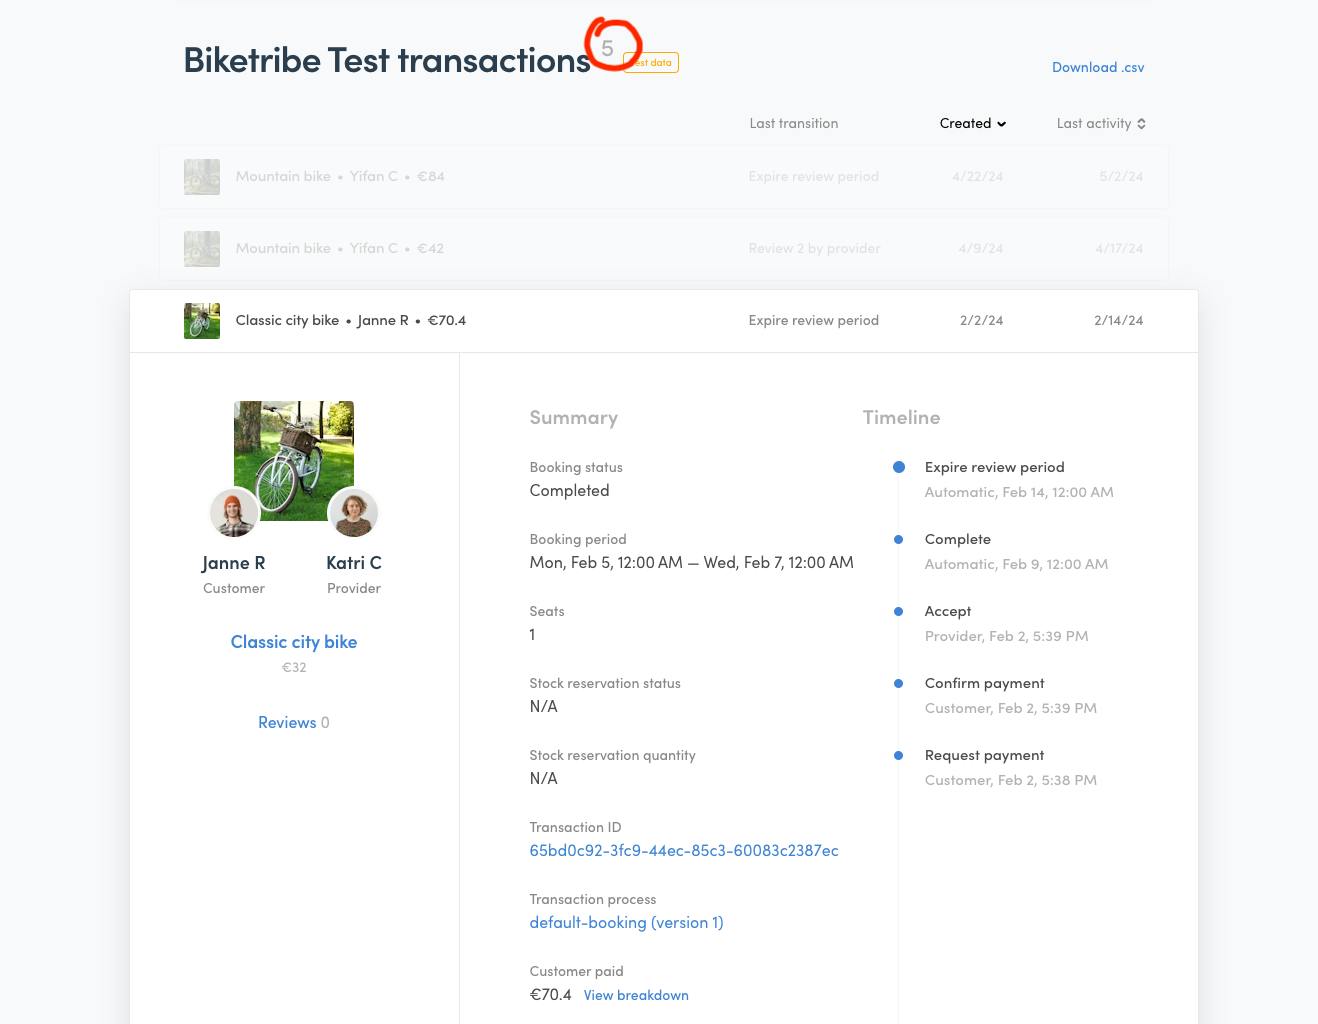
If you don't have an easy way of accessing this information within your marketplace, look into your third-party payment provider. There, you should find all transactions that involved an exchange of funds.
The number of transactions is a more reliable indicator of a marketplace’s growth than the number of active users. After all, this metric directly reflects the transaction volume on your marketplace.
The issue with the number of transactions is that it’s not actionable. If the number is lower than you hoped, it doesn’t tell you why that is or what you should change. If the number suddenly improves, you won’t know why it happened and how you can replicate it.
The number of transactions, therefore, could be a vanity metric if you don’t understand the underlying dynamics of your marketplace (meaning: liquidity).
Now that we’ve examined the awareness, consideration, and conversion phases in your customer journey, the final stage remains: Are the users who completed an action on your marketplace staying?
Churn rate measures the rate at which users stop doing business with your marketplace. For a marketplace, it’s often useful two identify and track churn for both sides of the marketplace: seller churn and buyer churn.
Churn rate is calculated by dividing the number of buyers or sellers who have left during the specified period by the total number at the start of the period:
Churn rate = (Number of churned customers / total customers at start of period) × 100%
If your marketplace monetizes through subscriptions, tracking churn is easy: the number of churned customers is the number of canceled subscriptions within the time period.
This isn’t the case for most marketplaces. More often than not, users—buyers especially— simply stop using the marketplace without completing an action (like deleting their account). To gauge your churn rate, you could look at a user’s latest activity and create a theoretical point of time after which you consider the user as churned.
For the seller side, churn could be easier to identify as deleted accounts of closed listings.
If your marketplace is powered by Sharetribe, you can use the Events functionality to retrieve data on users’ activity on your marketplace.
Churn is a key metric for many online businesses. If users engage and transact on your platform once, that means they understand your value proposition and are willing to pay for it. Understanding why they don’t want to do it again can give you great insight into how you can make your marketplace more valuable.
Secondly, it tends to be much more expensive to acquire new users than to retain existing ones (more on customer acquisition costs later). So, improvements that decrease churn can be much more impactful than projects aimed at growing top of the funnel.
However, the nature of your marketplace impacts how you’ll analyze churn.
For example, on a real estate marketplace like Zillow, churn likely isn’t a key metric for the buyer side because private consumers rarely buy or rent apartments regularly. On the seller side, preventing churn is much more important.
In contrast, on a B2C or C2C product marketplace (think eBay, Etsy, or Vinted), churn is likely to be a key metric for both the seller and buyer side. Both selling and buying is typically recurring in nature on these types of platforms, so retaining both sides on the platform is critical.
On a service marketplace (like Thumbtack or Fiverr), high churn could also be a sign of platform leakage: the seller and buyer use your marketplace to find each other, then take their communication off-platform to circumvent your fees.
Low churn is a great indicator of user loyalty, but sometimes you might want to measure user satisfaction directly. This is often done through feedback forms and questionnaires, the most common of which is the Net Promoter Score (NPS).
The NPS assesses the likelihood that customers would recommend your marketplace to others.
The Net Promoter Score is obtained by asking the following question: "How likely are you to recommend [product] to a friend or colleague?"
The answer is a number from 0 to 10. This question works well because if someone is likely to recommend your product, it means they are getting value from it themselves. This gives you more accurate satisfaction results than simply asking if your users like your product or not.

The respondents are divided into three categories based on their answers:
- 9-10: Promoters. Promoters are loyal enthusiasts who will keep buying and refer the service or the product to others.
- 7-8: Passives. Passives are not enthusiastic customers, but they are satisfied with the product.
- 0-6: Detractors. Detractors are unhappy customers who will share their disappointment and affect your brand.
The NPS score is then calculated as:
(Number of promoters − number of detractors) / total number of respondents)
An NPS score that is positive (higher than zero) is generally considered good, and an NPS of +50 is excellent.
High scores on user satisfaction metrics like NPS indicate strong customer loyalty and satisfaction, which are critical for organic growth through word-of-mouth and repeat business. Low scores may indicate underlying issues with the marketplace experience that need addressing to improve customer retention. What’s more interesting than a one-off number is tracking how your NPS score develops over time.
To be fair, NPS has received quite a bit of criticism. Among other things, some find it to be culturally insensitive and not as good a predictor as certain, more complex questionnaires.
Furthermore, there are other ways to measure how well your marketplace is providing value. Next, we'll turn to these critical groups of metrics: repeat usage metrics and liquidity metrics.
Repeat usage is an important area to measure because it's a clear indicator of marketplace product-market fit. For most early-stage marketplaces, it makes the most sense to track the repeat purchase rate (and GMV retention, which I'll discuss in more detail in the marketplace revenue metrics section). Some might also want to look at the ratios and volumes of repeat buyers and sellers.
Repeat purchase rate measures the engagement and loyalty of your users by tracking the share of total transactions that come from returning users.
To calculate repeat purchase rate, use the following formula:
Repeat purchase rate = (number of repeat purchases / total number of purchases) × 100%
Tracking repeat purchase rate can get a little complicated if you've built your marketplace from scratch and don’t have an elaborate Customer Relationship Management (CRM) tool (which, in the early stages, you very likely don’t need).
If your marketplace is powered by Sharetribe, you can export data on users into a CSV file and use Excel or Google Sheets. Each user on your marketplace has a unique ID, which you can use to get information on the users who have repeat transactions.
A high repeat purchase rate is a strong indicator that your marketplace is solving a real problem for users. Repeat users are valuable because they tend to spend more over time and require less effort to convert than new buyers.
A high repeat purchase rate reduces your customer acquisition costs while driving consistent sales. It suggests that your marketplace is providing a positive user experience, strong buyer-seller matches, and a compelling value proposition that encourages buyers to return.
Repeat buyer volume and ratio measure how well your customer side returns to your marketplace to make additional purchases.
Repeat buyer ratio measures the share of buyers that have made an earlier purchase on your marketplace.
Repeat buyer volume is the total sales volume generated from repeat buyers (or the share of repeat buyer volume of your total volume.
To calculate repeat buyer volume and ratio, use these formulas.
Repeat buyer ratio = (number of repeat buyers / total number of unique buyers) × 100%
Repeat buyer volume = total value from repeat buyers
Share of total value from repeat buyers = (repeat buyer volume / total sales volume) × 100%
Similarly to repeat purchase rate, tracking repeat buyer ratio and volume likely requires some manual work. If you're working with Sharetribe and Stripe, you can use the unique IDs of your buyers to check which customers have repeat transactions.
For the repeat buyer volume, the same CSV file lets you calculate the repeat seller volume both with and without commission
These metrics provide insights into customer loyalty and satisfaction. High repeat buyer volume and ratio indicate that customers are satisfied with your marketplace experience and are likely to recommend your platform to others.
If these metrics are low, it may indicate dissatisfaction or significant competition drawing your customers away.
Repeat seller ratio and repeat seller volume both measure the extent to which sellers continue to engage with the platform by listing new items or repeating sales after their first transaction.
The repeat seller ratio measures the share of your total sellers that have repeated sales.
Repeat seller volume means the total sales volume that comes through repeat sellers (or, most often, the share of repeat sales volume of your total sales volume).
To calculate repeat seller ratio and repeat seller volume, use these formulas:
Repeat seller ratio = (number of repeat sellers / total number of unique sellers) × 100%
Repeat seller volume = total sales from repeat sellers
Share of total sales from repeat sellers = (repeat seller volume / total sales volume) × 100%
Similarly to repeat buyers, tracking repeat sellers without a CRM needs some manual work. Again, you can export data from Sharetribe and Stripe, if this is the marketplace setup you’re using, and analyze it in a spreadsheet.
The share of repeat sellers on your marketplace further helps you understand seller success and how well your marketplace is delivering on its seller value proposition.
On most marketplaces, suppliers can participate in multiple transactions. This makes a single seller more valuable than a single buyer—and attracting and retaining sellers critical for the overall success of your marketplace.
A high number of repeat sellers is a sign that your marketplace is growing on a healthy foundation of successful, satisfied suppliers. It’s a good indicator of future revenue streams and growth potential.
Repeat usage tells you that your marketplace does a great job of solving a problem for a group of users. But there's a group of metrics that is, arguably, even more important for marketplaces to track: marketplace liquidity.
In the context of online marketplaces, liquidity measures how likely it is that a transaction will happen on your marketplace.
Facilitating transactions is a key value proposition for any marketplace. That makes liquidity the single most important marketplace area to track.
Marketplace investor and expert Josh Breinlinger highlights this well in our interview:
"As a marketplace founder, your product isn’t your marketplace. Your product is liquidity."
This means liquidity is a key indicator of your marketplace’s growth potential—not the number of users or transactions.
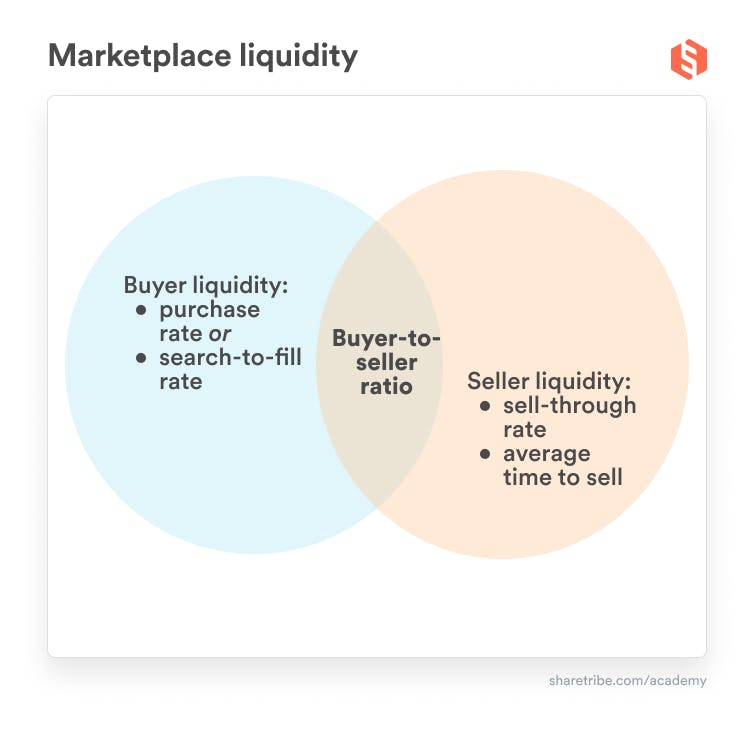
To understand liquidity, you need metrics that track:
- The balance between buyers and sellers on your marketplace.
- How well you’re providing value to sellers.
- How well you’re providing value to buyers.
Here are the key marketplace liquidity metrics and how you can track and analyze them.
Buyer-to-seller ratio is a cornerstone marketplace metric that helps you understand your marketplace dynamics. It sets the foundation for planning your entire business strategy and helps keep your user base balanced.
The definition of the buyer-to-seller ratio is the number of customers that one seller can serve.
There’s no single number for buyer-to-seller ratio that every marketplace should strive for. Instead, you should aim at identifying the right ratio in your specific market.
The buyer-to-seller ratio is calculated by dividing the total number of active buyers by the total number of active sellers on the marketplace platform during a specific period:
Buyer-to-seller ratio = number of buyers / number of sellers
For example, if a marketplace has 1,000 active buyers and 100 active sellers, the buyer-to-seller ratio is 10:1.
It’s important to regularly monitor this ratio to identify trends over time. A high ratio (in relation to your optimal ratio) may indicate insufficient supply, which could drive higher prices or lead to buyer churn due to unmet demand. Conversely, a low ratio might suggest an oversupply, risking seller dissatisfaction due to increased competition and lower sales opportunities.
The optimal buyer-to-seller ratio can vary significantly depending on the nature of your marketplace, the industry, and specific customer needs.
For example, on a typical real estate marketplace, the ratio is 1. A single house can typically be sold to a single buyer, and then it’s off the market.
On a marketplace for stock photography, the ratio could be in the ballpark of 10,000:1.
The demand and seller capacity in your target market will impact your optimal Buyer-to-Seller ratio. Is there lots of steady demand, or is the demand more niched or seasonal? What’s the limit of the seller’s capacity?
Your market type will also play a role. For instance, commodity marketplaces typically need a higher buyer-to-seller to be able to offer a wide range of products at competitive prices. Niche marketplaces might thrive with a lower buyer-to-seller ratio because there’s less competition and for specialized products, the quality of supply is a more critical factor.
If there are marketplace competitors targeting your exact niche, benchmarking their ratios is a good idea. However, identifying your optimal buyer-to-seller ratio is likely the result of constant adjustment and experimentation.
That’s one more reason why starting with a small initial group of users is a great idea. With a limited user base, you have a great opportunity to monitor and iterate on the ratio of buyers and sellers, identify the sweet spot, and use this information to guide your user acquisition strategy.
The buyer-to-seller ratio informs your user acquisition strategy at every stage of your marketplace growth.
If you’ve identified that your optimal buyer-to-seller ratio is high, each new seller you onboard is very valuable because they can participate in multiple transactions. The obvious conclusion to draw from this is that you should really focus on building supply in the beginning to increase the value of your marketplace.
On the other hand, if your ideal ratio requires lots of sellers to satisfy demand, you will eventually need to grow your customer base at a faster rate than your seller base.
Generally, if you notice your buyer-to-seller ratio tilting towards having too many customers compared to sellers, act fast.
Idle customers are more dangerous than idle providers. If a host can’t get bookings via Airbnb, the likeliest action they take is to keep their listing open on Airbnb but list it on other sites as well. Not ideal, but also not a death sentence to Airbnb.
Meanwhile, if a customer can’t find what they are looking for from Airbnb, they might also go look on another site. But if they’re happy with the experience, they might never return to Airbnb.
Knowing your optimal buyer-to-seller ratio will allow you to identify these risks early and direct your resources toward acquiring the right types of users at the right time.
Knowing your optimal buyer-to-seller helps you manage two critical liquidity metrics we’ll look at next: the sell-through rate and the purchase rate.
Sell-through rate is the seller-side liquidity metric. It means the percentage of listings that result in a sale within a certain time frame. This is a key metric to understand how well you’re providing value to your sellers.
Your marketplace type plays a role in how you measure sell-through rate.
On product marketplaces like Amazon, Ebay, or Etsy, you should measure the share of stock of a single seller, or the percentage of the overall stock, that's sold on a given time period (like monthly or quarterly). That is:
Sell-through rate = (Stock sold / total stock (overall, or of a single seller)) x 100%
On rental marketplaces like Airbnb, Turo, or WeWork, sell-through rate is typically measured by how much usage the rental property or good is getting or how big a proportion of all assets are booked on a given day. Example calculations could be:
Sell-through rate = (Usage hours of a property / total availability) x 100%
Sell-through rate = (Assets booked / assets available) x 100%
On service marketplaces and on-demand platforms like Uber, Upwork, or Thumbtack, you might want to look at hourly utilization. How many hours of the day can the supply successfully sell on your marketplace:
Sell-through rate = (Total hours sold / total available hours) x 100%
You might also be interested in hourly engagement rate: how big a share of sellers are actively serving a customer on a given hour of the day:
Sell-through rate = (Number of sellers engaged in a given hour / total number of sellers) x 100 %
Calculate this metric regularly—daily, weekly, monthly, or quarterly, depending on your business model and the dynamics of your marketplace. For an early-stage marketplace, tracking sell-through rates using Excel or Google Sheets may be sufficient. Use formulas to automatically calculate the rate whenever new data is entered.
The higher your sell-through rate is, the better your marketplace is delivering on its key value proposition to sellers: sending business their way.
There are two more metrics that can help you gauge seller success: average time to sell and repeat seller volume.
Average time to sell means the average duration from listing an item to its sale (for the first time, if the listing can be sold multiple times, like on rental and service marketplaces or marketplaces for products with stock.
To calculate average time to sell, you first need to list the time to sell (most often measured in days) of each individual item sold during a specific time period.
Then, the formula to calculate average time to sell is:
Average time to sell = number of sold items / sum of sell-times of individual items.
To track average time to sell, you need to pieces of data:
- Listing date
- Sell date
If your marketplace is built on Sharetribe, you can export this data from your Sharetribe Console.
Review average time to sell regularly to monitor improvements or changes. If your marketplace is targeting multiple categories or geogrhaphies, you might benefit from looking at this number for individual categories or locations to identify where improvement is most urgently needed.
This metric, in combination with the sell-through rate, tells you how well your marketplace provides value to sellers.
Specifically, this metric tells you how soon a new seller on your marketplace experiences its value. As we discussed, idle customers are generally more dangerous than idle sellers. However, especially for marketplaces where the value of a single seller is high, a very long average sell time is likely to reflect negatively on the seller’s commitment to your platform.
Purchase rate is the buyer-side liquidity metric. It measures the frequency at which visitors to your marketplace complete a purchase. This metric is crucial for understanding how effectively your marketplace can convert browsing into sales.
To calculate purchase rate, use the formula:
Purchase rate = (Number of purchases / total visits) × 100%
Track your purchase rate by monitoring the number of completed transactions and comparing it to the number of visits or unique visitors to your marketplace over the same period.
This metric is particularly valuable after implementing changes to layout, pricing strategies, or product offerings.
Purchase rate means the percentage of unique visits to your marketplace that lead to a purchase. It is to your customer side what sell-through rate is for sellers: a metric that tells you how well your marketplace is providing value to users, this time on the demand side.
A high purchase rate indicates that your marketplace is effectively converting visitors into buyers. It suggests that your product offerings and user experience meet customer needs well.
Conversely, a low purchase rate may highlight issues in your buyer-to-seller ratio, pricing, product-market fit, or website functionality.
According to the marketplace expert Simon Rothman, a good goal for your purchase rate is between 30 and 60 percent.
The other two metrics to look at on the buyer side are search-to-fill rate and repeat buyer volume and ratio.
The search-to-fill rate measures how often searches on your marketplace result in a transaction. This metric further helps you evaluate the availability of relevant listings (and your marketplace UX).
Tracking your search-to-fill rate is particularly useful when your purchase rate data is muddied by lots of visits that you don’t expect to lead to a purchase (if, for example, you’ve made a big marketing campaign to acquire new sellers and the majority of visits to your site are from them). Typing something into your marketplace search is a good indicator that a lead is a potential buyer.
The search-to-fill rate is calculated by the following formula:
Search-to-fill rate = (Number of successful searches / Total searches) ×100%
Track this by analyzing search data and related transactions. An analytics tool like Plausible or Google Analytics integrated into your marketplace platform is helpful.
A high search-to-fill rate means that users find what they are looking for and proceed to make a purchase.
This tells you two things:
- You have good, relevant supply for the customers you attract.
- Your marketplace search and matching experience works well.
A low rate may suggest that users are searching for items or services that are not available or that the search functionality needs improvement to better match user queries with available listings. To identify the source of the problem, look further into the keywords your customers use on your marketplace and analyze what distinguishes unsuccessful searches from successful ones.
In summary, you can analyze your liquidity by understanding your optimal buyer-to-seller ratio and then looking at the key metrics that identify how well your marketplace is providing value to sellers and buyers. The sell-through rate and the purchase rate are most commonly used.
One of the world’s most influential angel investors, Fabrice Grinda, said this in our interview:
"Many people value growth over everything else, but this is a mistake. You need your unit economics to really work before you can grow sustainably."
Unit economics means the revenues and costs that are associated with one user. The most common way to measure them is with metrics like Customer Acquisition Cost (CAC), Customer Lifetime Value (CLV), and Contribution Margin per Transaction.
According to Grinda, the most common pitfall among marketplaces is failing to understand unit economics. Unit economics is also the most important factor FJLabs, the venture capital firm Grinda co-founded, considers when making investment decisions.
Customer acquisition cost is the cost associated with convincing a potential customer to buy a product or service from your marketplace.
CAC is calculated by dividing all the costs spent on acquiring more customers (including marketing expenses) by the number of customers acquired in the period the money was spent. The formula is:
CAC = total marketing and sales expenses / number of new customers acquired
Monitor CAC through your accounting and marketing performance data.
CAC indicates the efficiency of your marketing and customer acquisition strategies. A lower CAC relative to the average revenue per user (ARPU) or CLV suggests a sustainable business model, whereas a high CAC may signal that you are spending too much to acquire customers relative to the revenue they generate.
In addition to customer acquisition costs, it’s a good idea to keep track of the cost of acquiring the supply side. Seller acquisition cost measures the cost associated with attracting and signing up sellers to your marketplace.
Similar to CAC, calculate this by dividing all marketing and operational expenses related to onboarding new sellers by the number of sellers acquired:
Seller acquisition cost = total expenses on seller acquisition / number of new sellers acquired
Track this metric through detailed cost tracking and seller onboarding metrics.
This metric helps determine the efficiency of your seller recruitment efforts. A high cost may indicate that the process is too expensive, in which case you need more efficient seller acquisition strategies or an improved seller value proposition.
Revenue per transaction measures the average revenue generated from each transaction within the marketplace.
You can calculate your revenue per transaction by dividing the total revenue within a period by the number of transactions during the same period.
Revenue per transaction = Total revenue / number of transactions
Both these data points are usually easily available through your third-party payment provider.
Tracking revenue per transaction over time helps you gauge the business impact of changes in your product, offering, or pricing.
Cost per transaction measures the average of each transaction processed on your marketplace. This typically includes both direct and indirect costs.
To calculate cost per transaction, divide the total costs associated with running your marketplace by the number of transactions in the same period:
Cost per transaction = total costs / number of transactions
Costs can include the cost of operating the marketplace platform, payment processing fees, shipping costs, customer service and support costs, and so on.
When you know your average revenue and cost per transaction, you can use the data to calculate your Contribution Margin Per Transaction. It measures the profitability of each transaction on a marketplace.
Contribution Margin Per Transaction is calculated by by subtracting the costs associated with producing and selling a product or service from the revenue generated by that transaction.
Contribution Margin Per Transaction = revenue per transaction − costs per transaction
A high contribution margin per transaction indicates a healthy pricing strategy and cost structure. Each sale generates enough money to cover fixed costs and turn a profit.
Conversely, a low margin might signal that costs are too high relative to revenue. This means you’ll need to adjust either your pricing or your costs.
Customer lifetime value (sometimes used interchangeably with “Revenue per customer” or “Spend per customer” is a prediction of the total value your marketplace will derive from the entire relationship with a customer.
CLV is calculated by multiplying the average order value by the number of transactions per customer over a given period and then multiplying that by the average customer relationship duration.
The formula is:
CLV = average order value × number of transactions per customer × average customer relationship duration
Track CLV using customer sales data and analyzing changes over different cohorts.
CLV helps you understand how much each customer is worth in the long run. High CLV suggests that your customer acquisition strategies are effective and that you are succeeding in maintaining long-term relationships with customers. It also helps in making informed decisions about how much money you can invest in acquiring new customers and retaining existing ones (customer acquisition cost, CAC).
For example, Fabrice Grinda says his ideal marketplace investment prospect should have a CLV to CAC ratio of ten to one or higher.
Gross Merchandise Volume (GMV), take rate, and net revenue answer questions related to your revenue and profitability. These answers, of course, are fundamental to whether or not you have a viable business.
However, it tends to take a long time for a marketplace to grow and reach profitability, typically much longer than a standard eCommerce business.
That’s why it’s crucial that a marketplace founder also understands the liquidity and unit economics metrics describe above. They are the early indicators of a healthy marketplace business long before you’ve reached profitability.
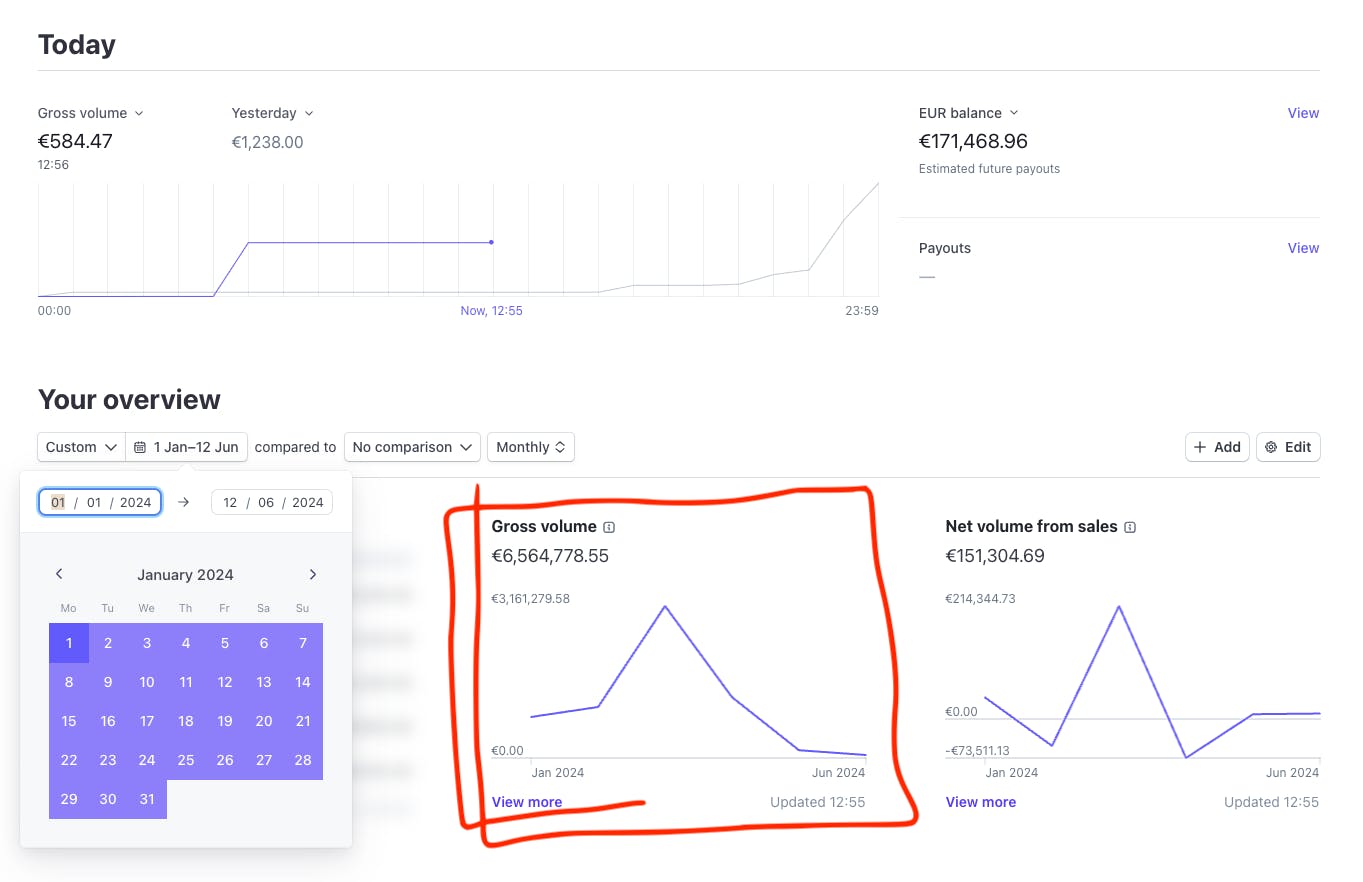
To understand if your marketplace is a good business, you should start with the Gross Merchandise Value (GMV).
Gross Merchandise Value means the total sales value of the products or services sold through your marketplace during a specific time period. If you want to only use one figure to measure the total growth of your marketplace, use this one (and not the number of users or transactions—more on these metrics later).
The exact method of calculating GMV depends slightly on the business model used. In a marketplace, GMV is generally calculated as the total value paid by customers within a certain time period.
The easiest way for you to track this is likely through your third-party payment provider—they typically offer a dashboard for tracking your key financial metrics.
For example, if your marketplace is built on Sharetribe, you have a pre-built integration with Stripe Connect. Here’s an example of how Gross Volume is reported on their dashboard.
GMV (Gross Merchandise Value) retention measures how much of your total GMV is retained from one period to the next. It helps you assess how well your platform keeps its users engaged and how consistently they generate revenue over time.
This metric is particularly valuable because it captures the long-term health of your marketplace. Rather than focusing solely on growth through new customers, GMV retention helps you understand how much of your revenue comes from existing users and their repeated activity.
Why should you look at GMV retention in addition to metrics like churn or repeat purchase rate?
Let’s break it down with an example from Andreessen Horowitz’s blog:
If ten users spend $10,000 in January and five return in February to spend $7,500, your one-month user retention rate is 50%. But your GMV retention rate is 75%. This indicates that while you may be losing some users, those who stay are spending more.
To calculate GMV retention, you’ll want to measure the percentage of GMV from a previous period that you’ve retained in the current period.
Andreessen Horowitz's blog has a great template you can use for tracking GMV retention per cohort.
As for the data, finding it might require some manual work. If you're using Sharetribe to power your marketplace and Stripe for payments, you could combine Sharetribe's transaction data and user IDs with Stripe's tracking on sales volumes.
High GMV retention is a sign of marketplace product-market fit.
It means that your platform isn’t just relying on acquiring new buyers or sellers to grow; instead, you’re able to retain and generate revenue from your existing user base. This is important because returning buyers and sellers tend to have higher lifetime value, are more engaged, and contribute to more sustainable growth compared to new users.
In many cases, GMV retention is more telling than short-term spikes in GMV. An increase in GMV driven solely by new buyers or sellers can mask underlying problems with user retention. By tracking GMV retention, you gain a deeper understanding of how strong your user relationships are and how much of your platform’s growth is based on a solid foundation of satisfied buyers and sellers.
GMV retention also tells you how well your marketplace is delivering on its value proposition for both buyers and sellers. If you see low retention, it may indicate issues with buyer experience or seller satisfaction—signals that you need to improve your marketplace’s core offering or address churn.
Marketplace take rate, sometimes called rake, commission, or transaction fee, is the fee your marketplace charges from customers when they complete a transaction on your marketplace. For most marketplaces, the fee is a percentage of the transaction value.
We’ve written in-depth about take rate in the context of choosing a marketplace business model and setting your marketplace pricing. In the context of marketplace metrics, we’re interested in take rate because combined with GMV, it lets you calculate your total revenue.
That said, take rate is also a metric of interest when you’re evaluating your competitive positioning or talking to investors. A high take rate suggests strong revenue potential, but at the same time, your pricing level needs to reflect the value your marketplace offers compared to competing solutions.
GMV is a good way to estimate the size of your marketplace business. But it’s not sufficient to understand your marketplace's health. You might process a huge GMV, but your take rate determines how much value you capture from that GMV.
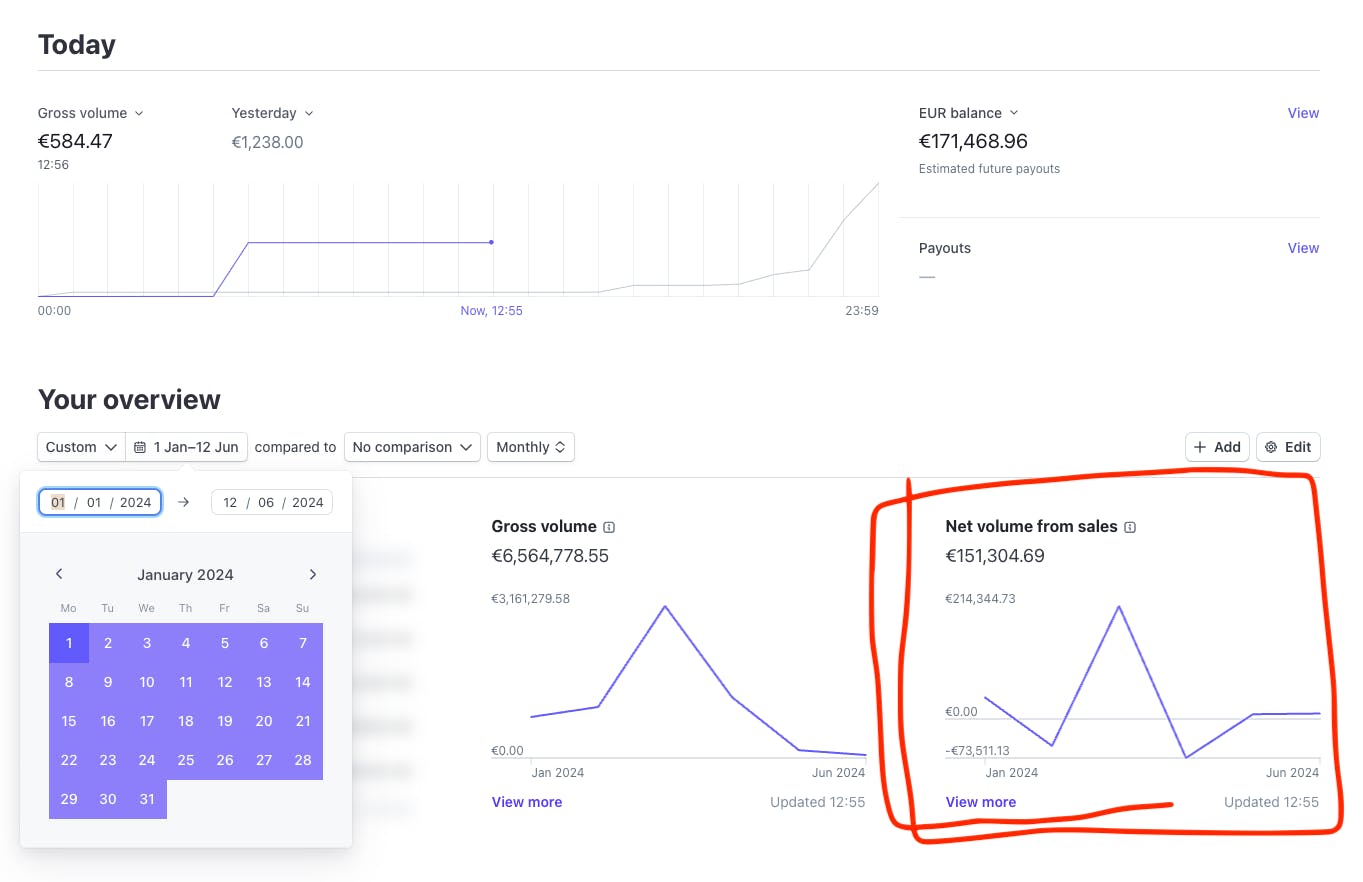
Total Revenue tells you how much value you’re capturing from your GMV.
Net Revenue deducts any immediate costs related to transactions from your Total Revenue (e.g. payment processing fees from your payment provider, cancellations or refunds, and discounts).
To calculate Total Revenue, multiply your GMV by your take rate:
Total revenue = GMV x take rate %
To calculate your Net Revenue, deduct all the expenses related to the transactions from your Total Revenue.
Most payment providers give you this information on their dashboards. Here’s Stripe’s.
Now that you know the most important metrics to follow, it is time to use them in practice. First of all, you need to set up a system to collect data.
For tracking your user funnel, any analytics provider works. If your marketplace is powered by Sharetribe, you can choose between Google Analytics and Plausible. Either of them is a great starting point. Google Analytics is free and very flexible. Plausible has a small monthly fee for small businesses, but it’s a more lightweight and privacy-friendly solution as it uses no cookies and is fully compliant with GDPR, CCPA, and PECR.
For liquidity, unit economics, and revenue metrics, no such standard tool exists. Instead, you can simply build a spreadsheet and update the data manually on a regular basis (e.g. daily or weekly).
This approach doesn’t scale to tens of thousands of users, but in the early days, it is a great, lean way to get started quickly. There are some good templates online that you can use as a baseline, e.g. this marketplace KPI spreadsheet by Boris Wertz and Angela Tran Kingyens, or this one by the venture firm Daphni. If you want, you could use and use Keen.io or Plot.ly to build a dashboard.
In this article, we’ve discussed a very long list of marketplace metrics: marketplace user funnel metrics, liquidity metrics, unit economics metrics, and revenue metrics.
Each of the four groups contains essential metrics for you to track, and metrics that can risk distracting you from the main goal. The difference between a “vanity metric” and a “clarity metric” varies from business to business.
For a marketplace, the key to long-term growth is understanding how well your marketplace provides value to users. This is why understanding and monitoring liquidity is the most important thing for any marketplace.
You might also like...


What to do if your marketplace business slows down
Five recommendations to consider for your marketplace during times of slower business. Some can help you make it through these difficult times, others prepare your business for better ones ahead.

"Network effects are key to successful marketplaces," says James Currier
The managing partner of NFX Guild believes a new class of businesses—ones that combine aspects from marketplaces and social networks—is being created.

Brian Rothenberg at the Marketplace Conference: Driving growth via buyer/seller overlap
Trust Eventbrite’s VP of Growth: if customers are turning to providers on your marketplace, you’re on to something magical.
Start your 14-day free trial
Create a marketplace today!
- Launch quickly, without coding
- Extend infinitely
- Scale to any size
No credit card required